


Re/max Premier Inc., Brokerage
9100 Jane St
Concord, ON
L4K 0A4


Fonthill, Fonthill, L0S 1E6
$939,000
Listed by RE/MAX NIAGARA REALTY LTD, BROKERAGE.
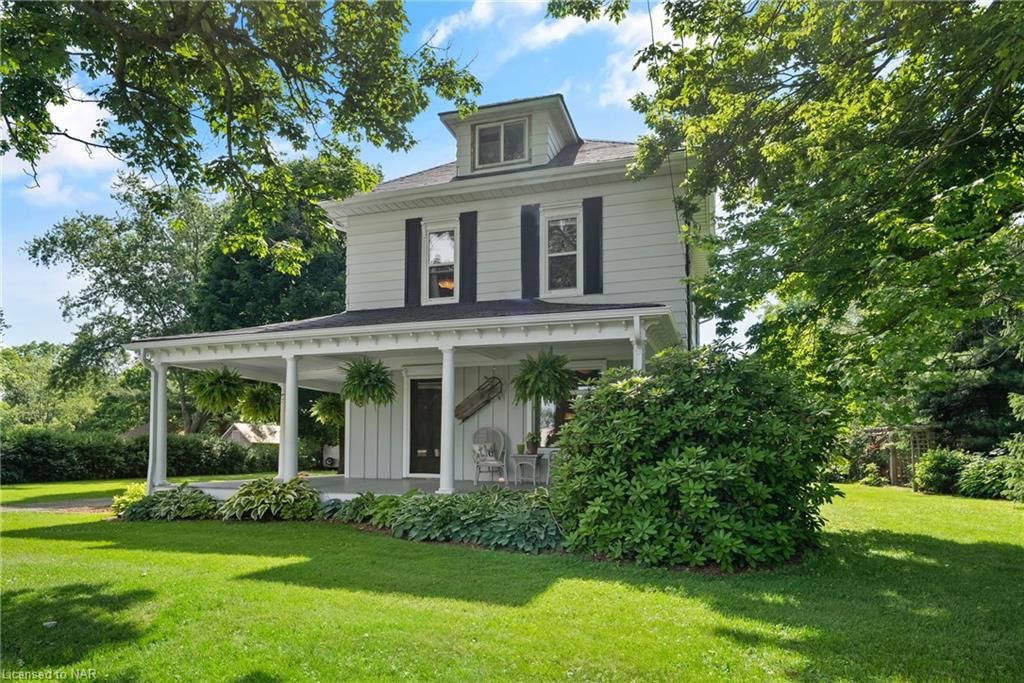
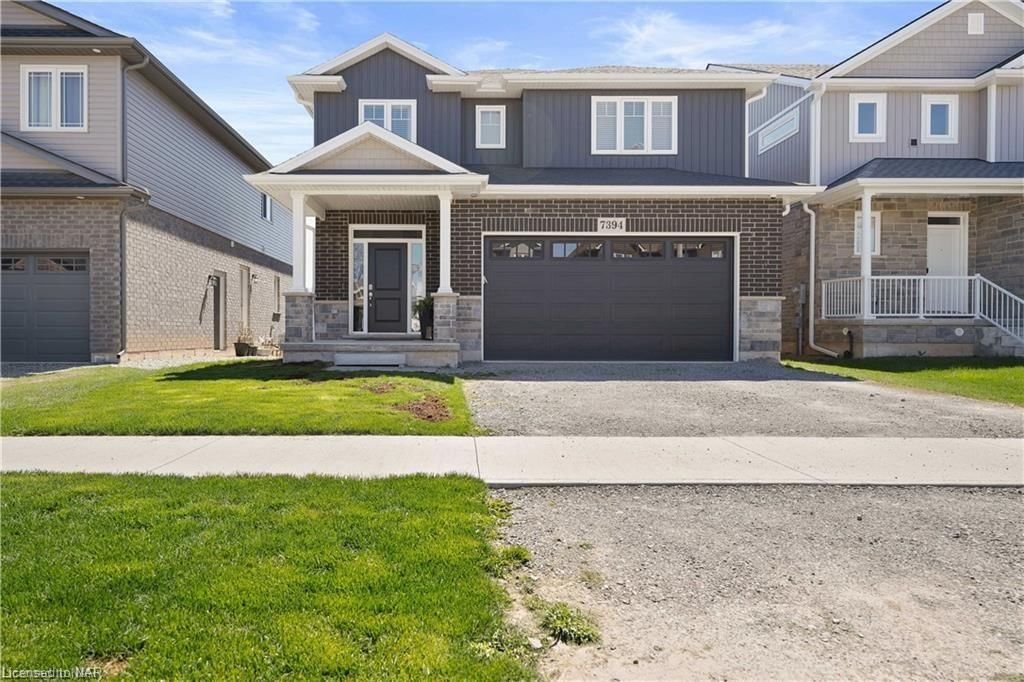
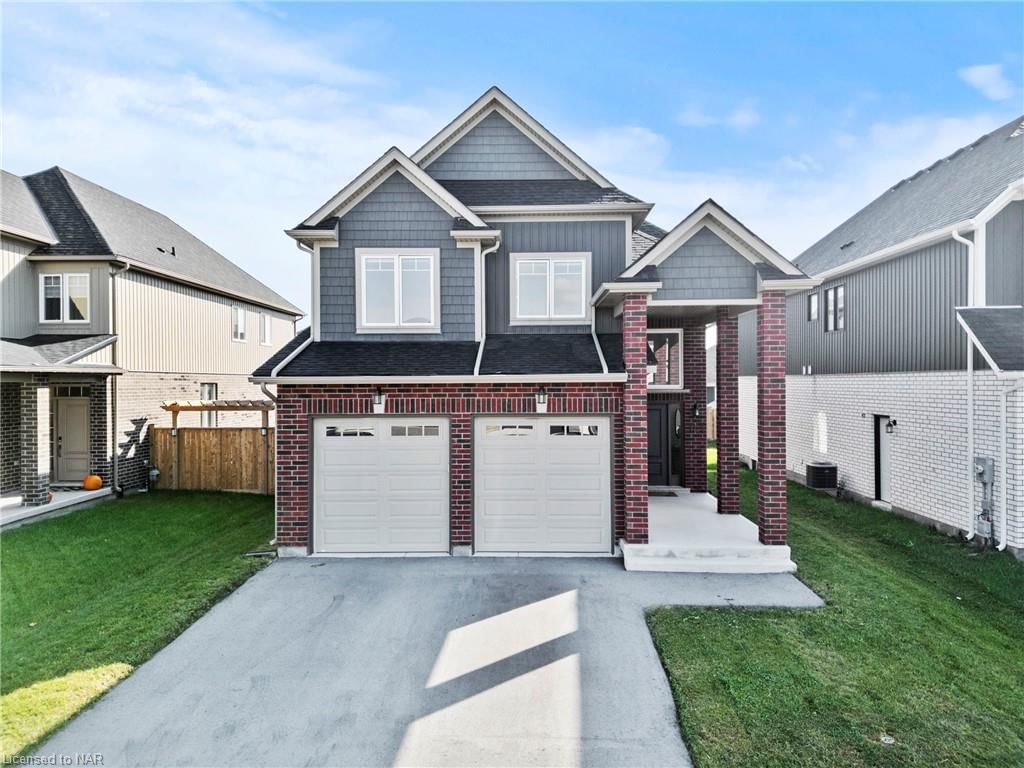
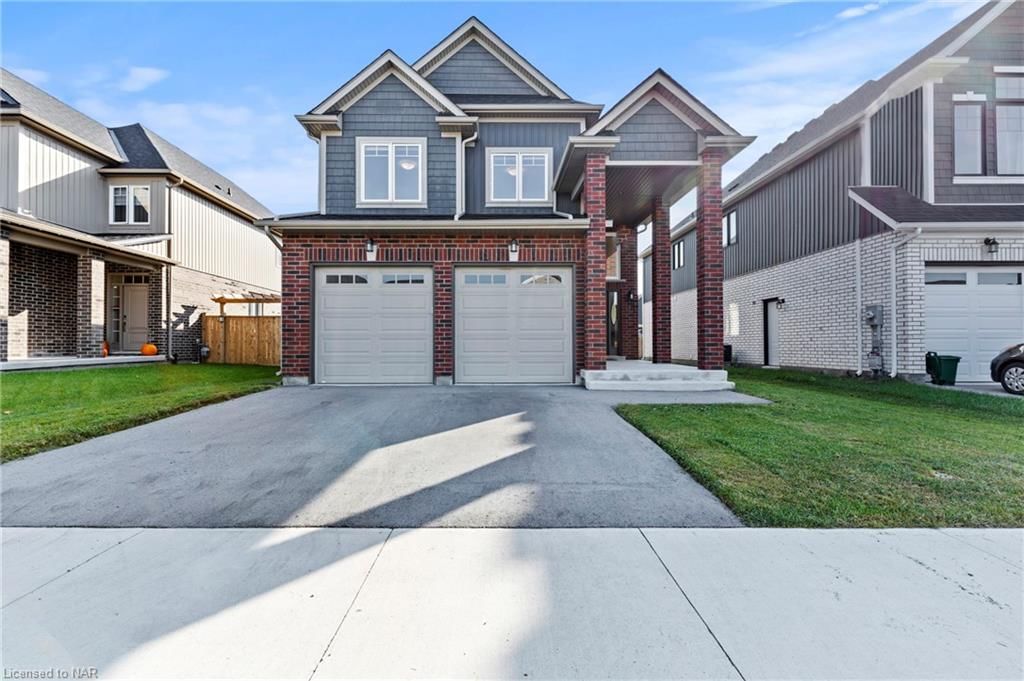
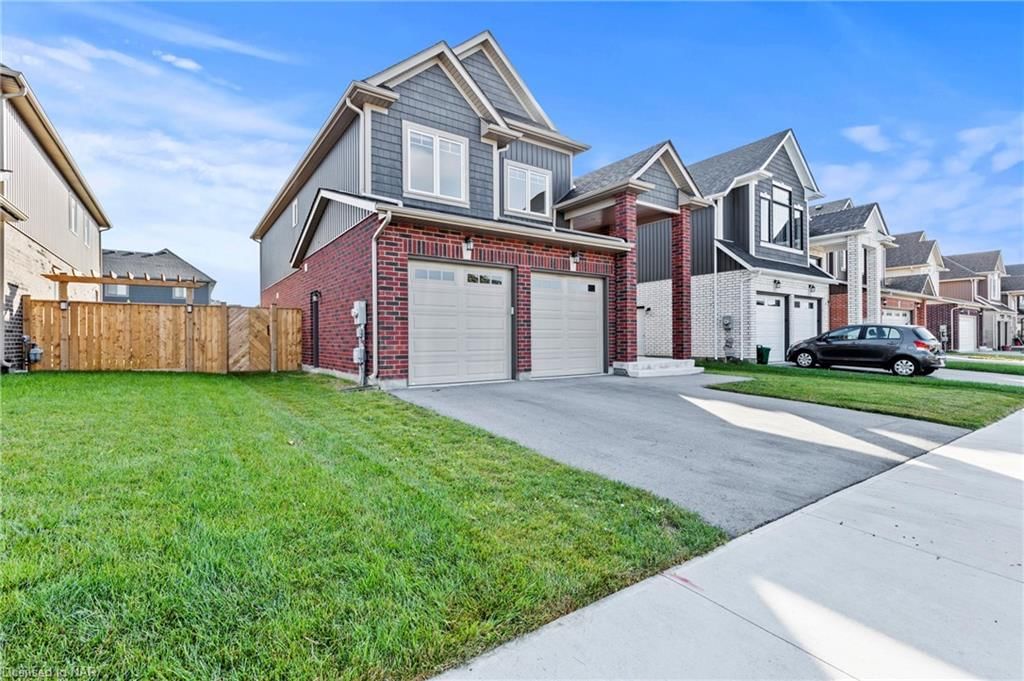
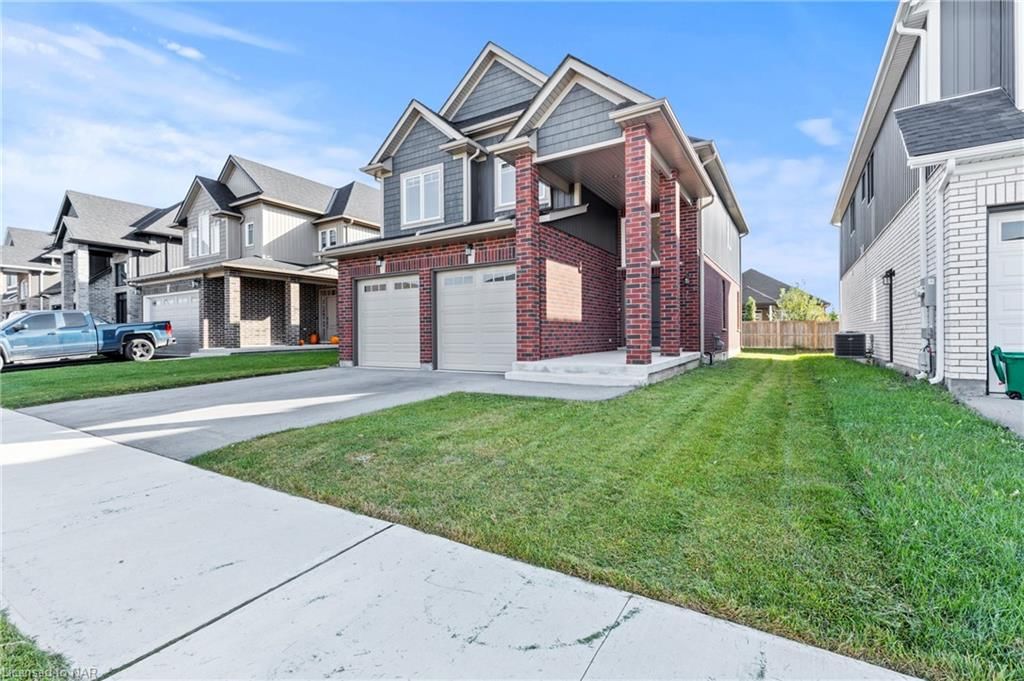
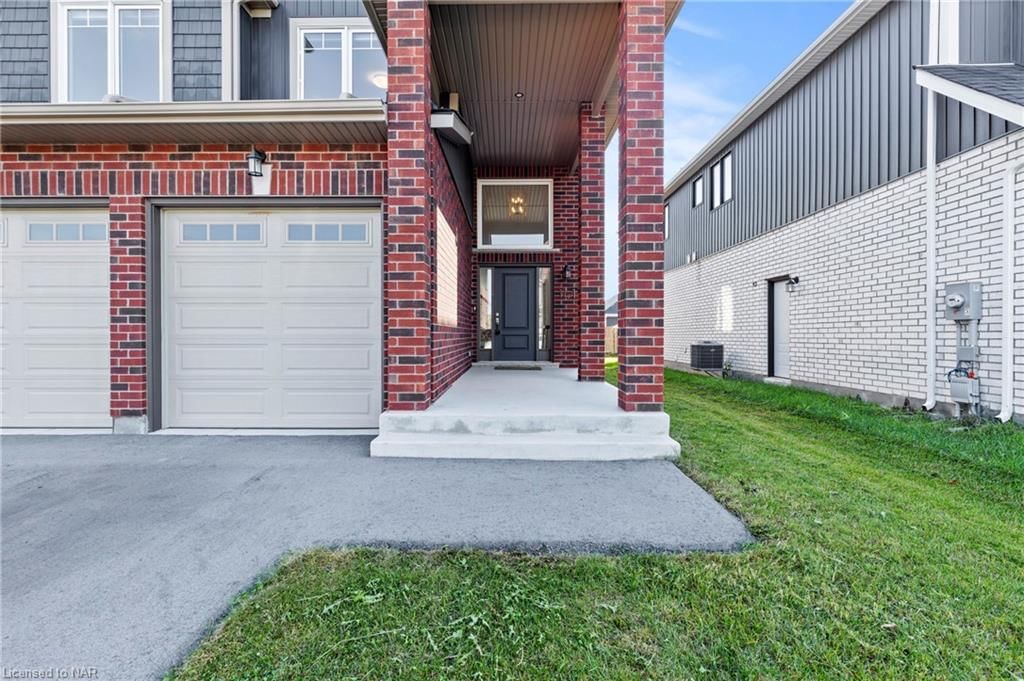
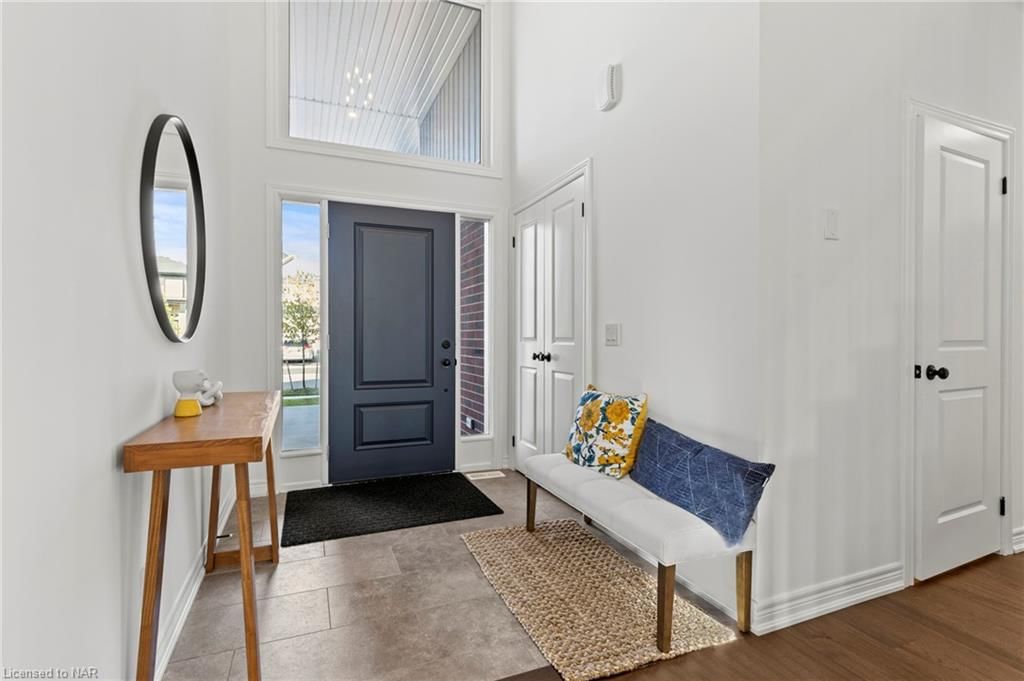
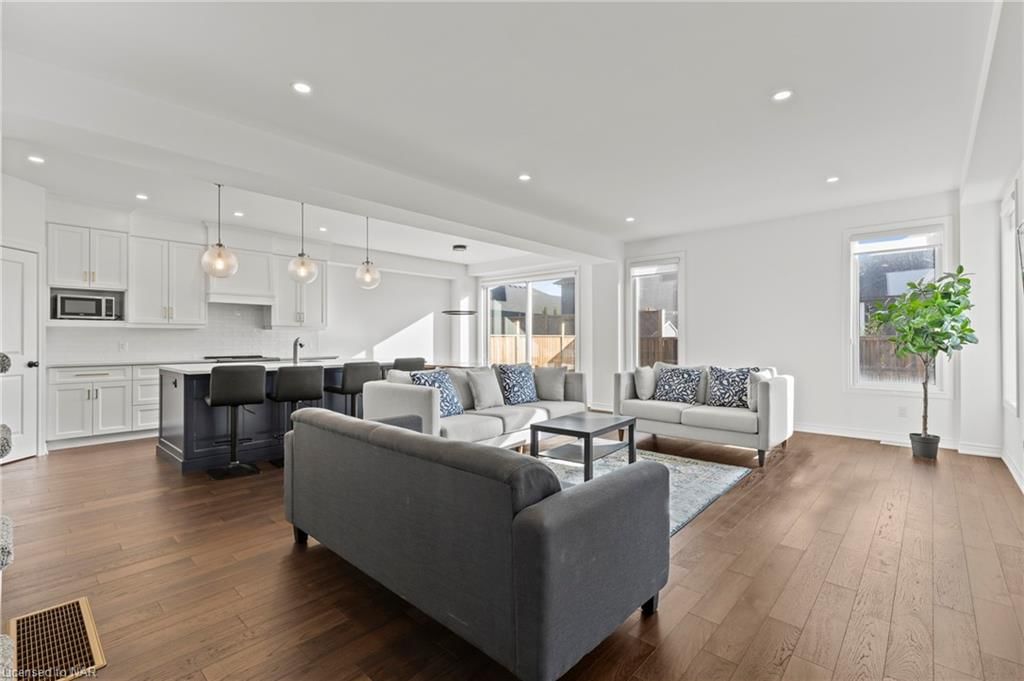
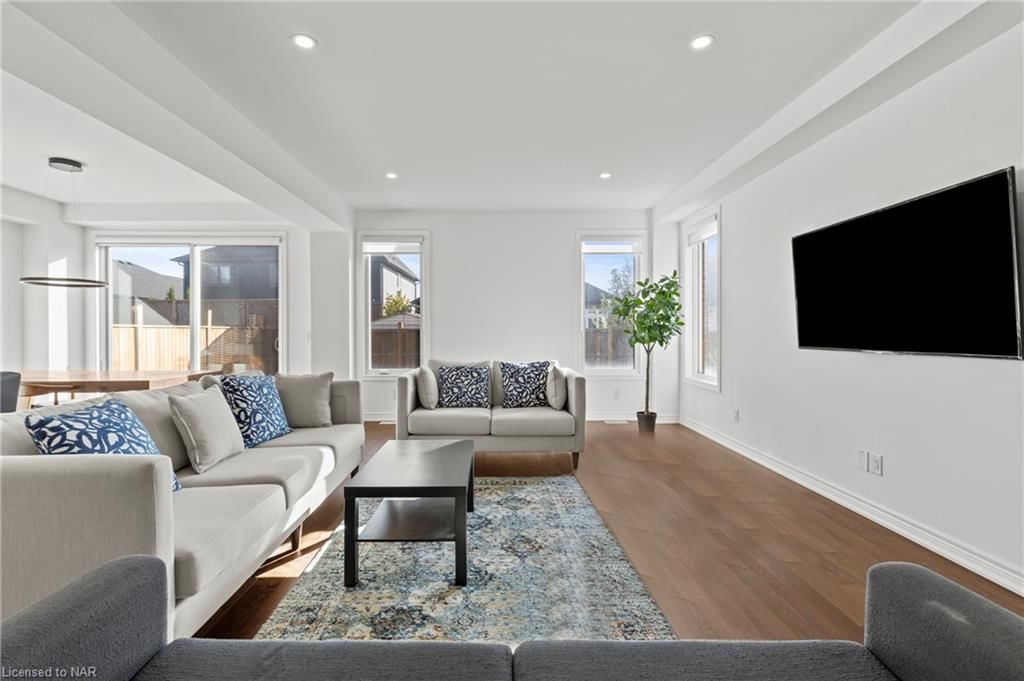
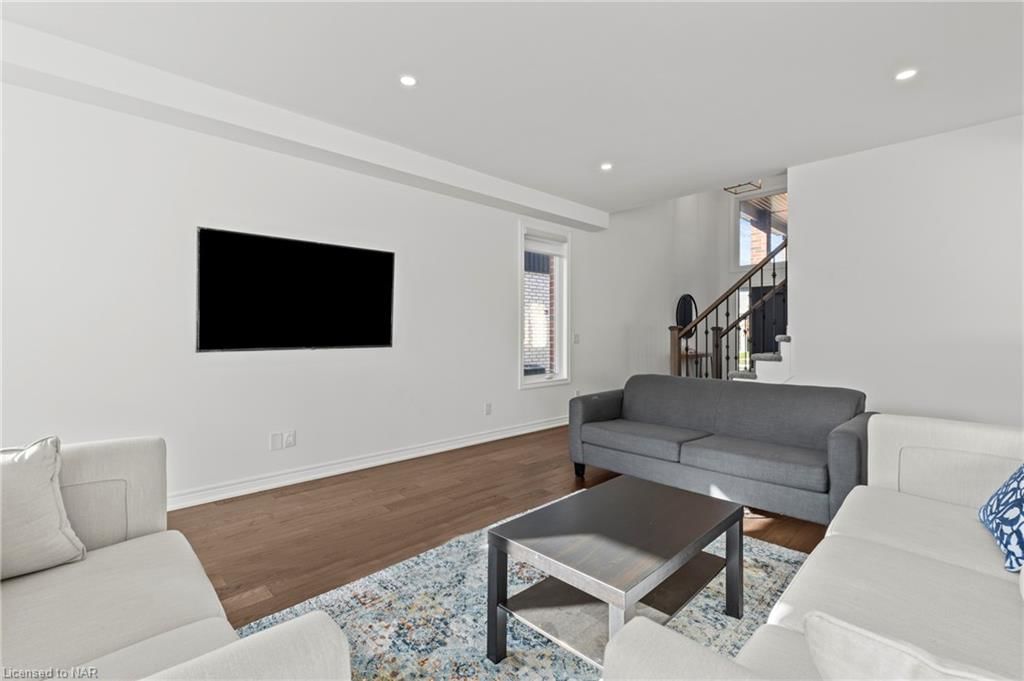
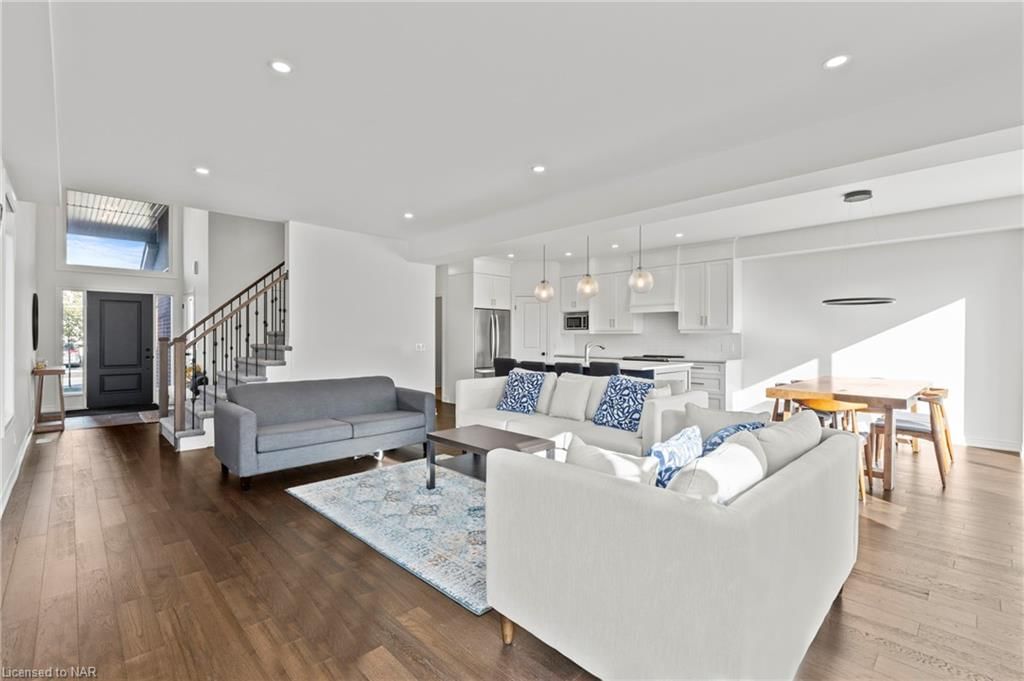
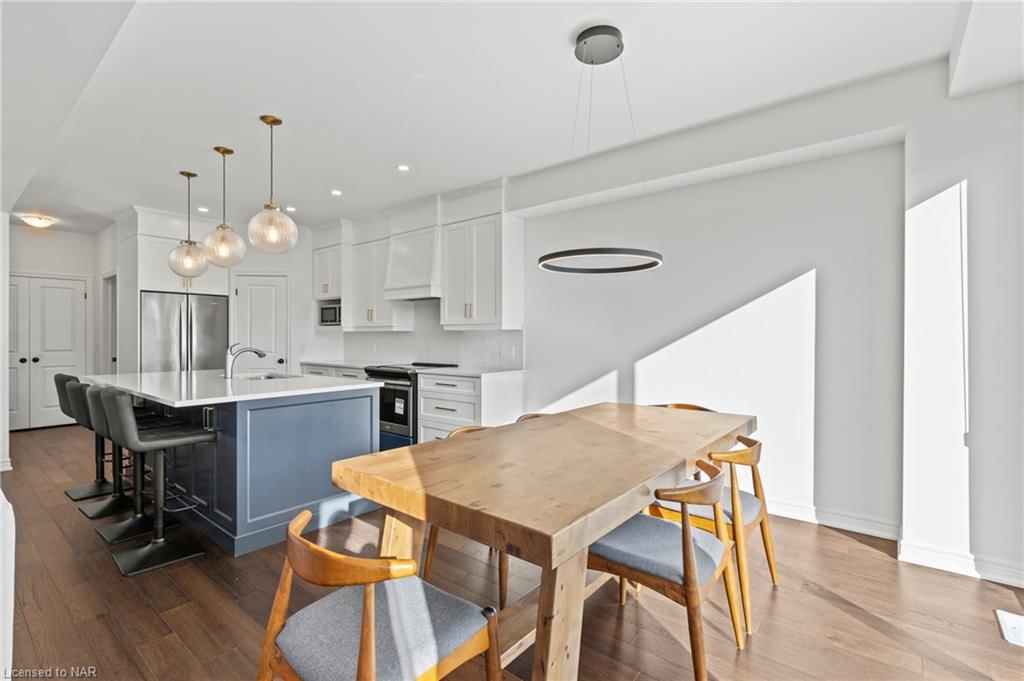
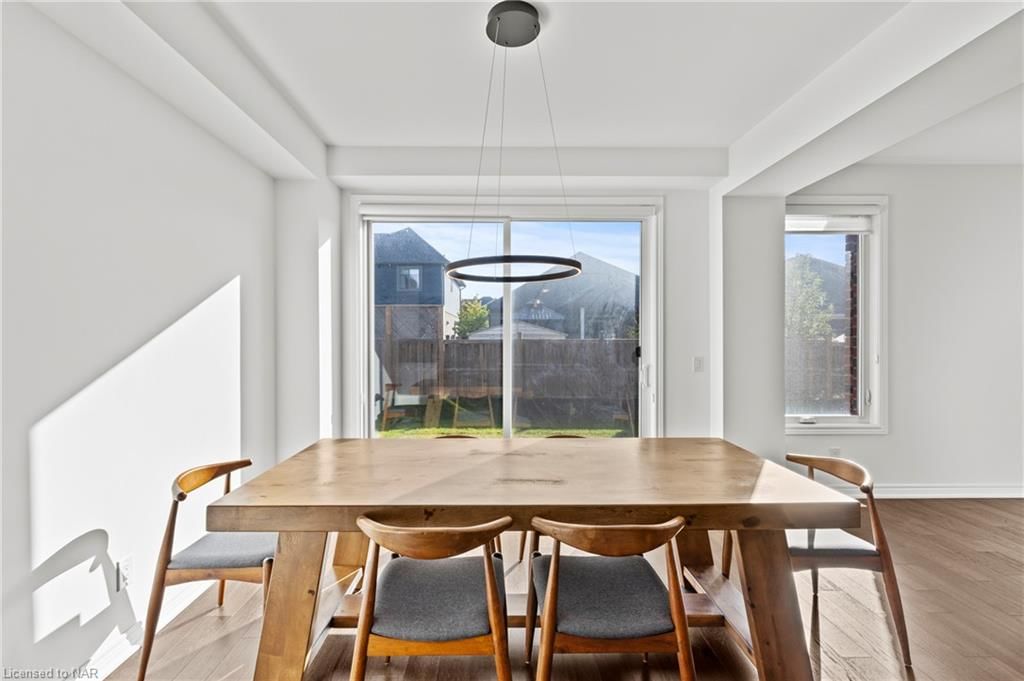
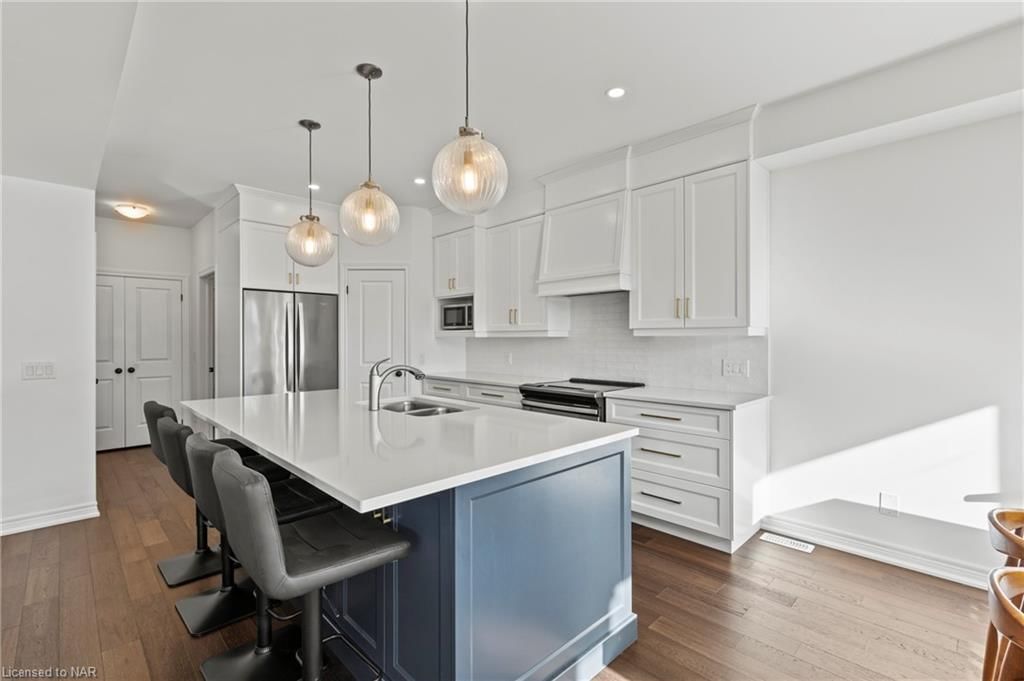
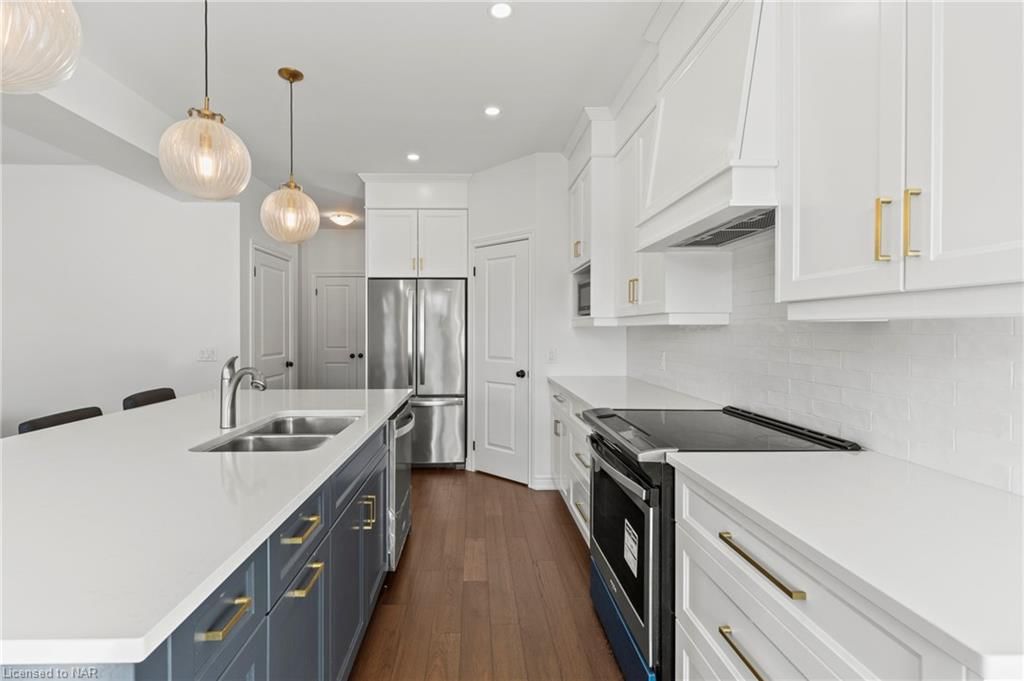
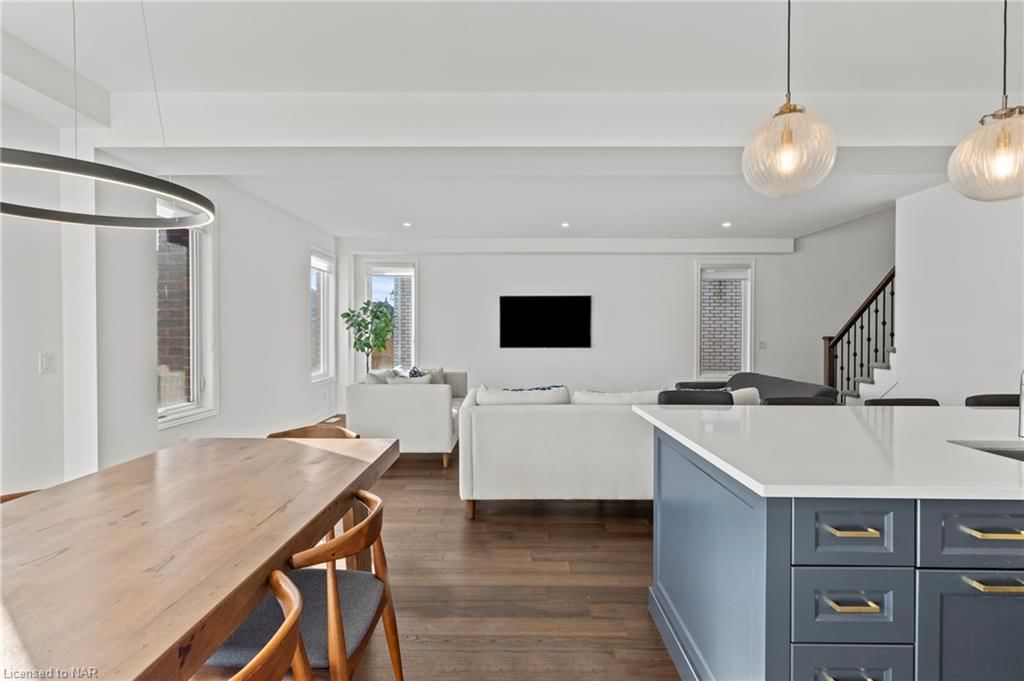
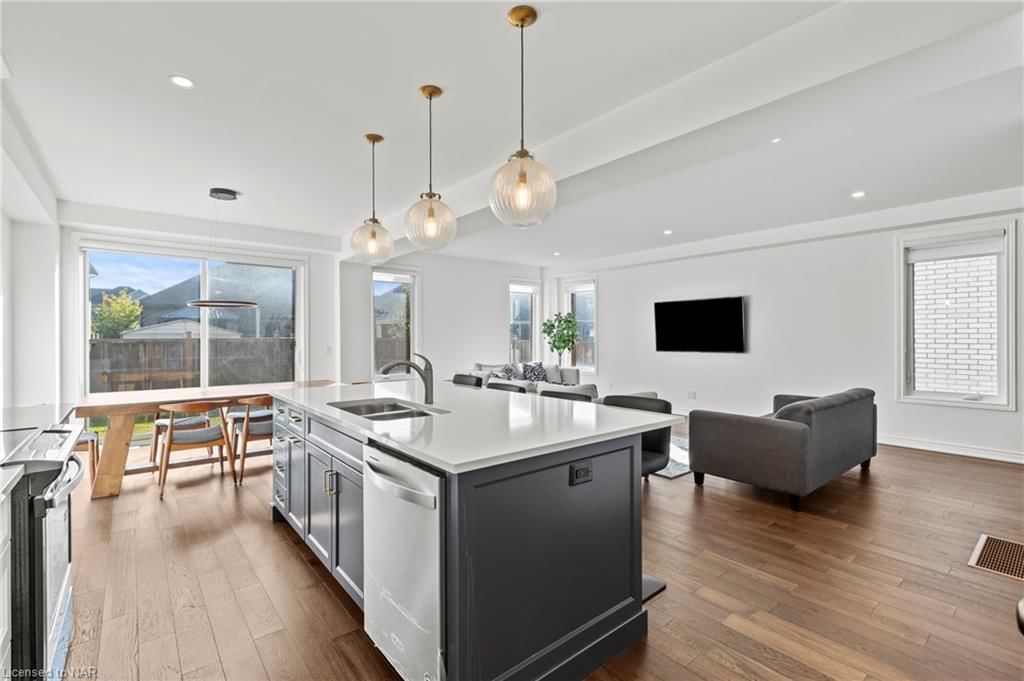
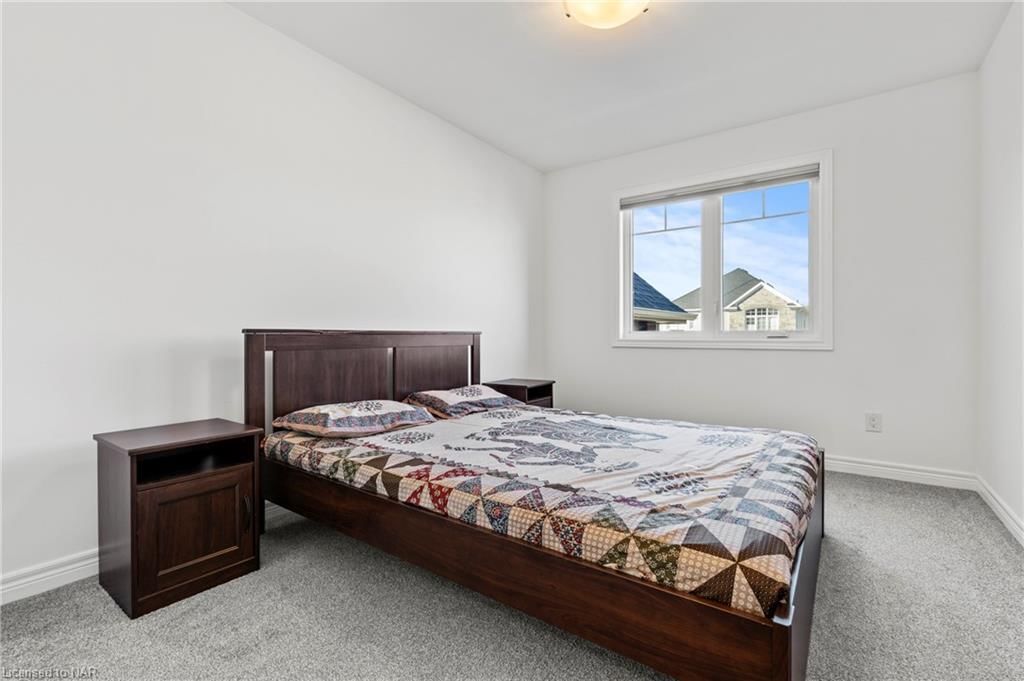
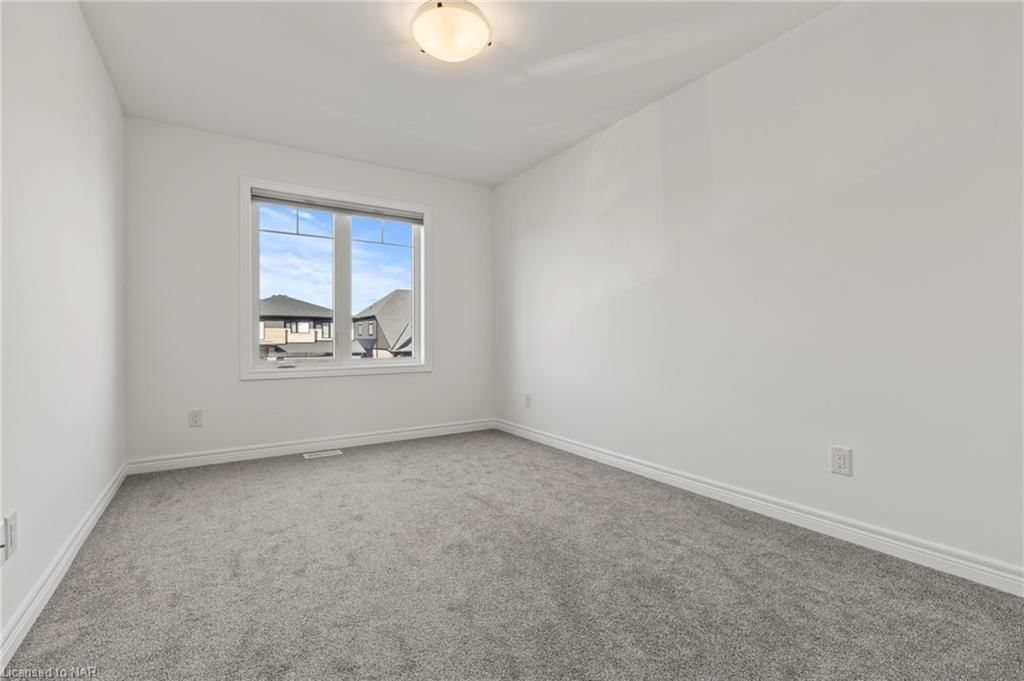
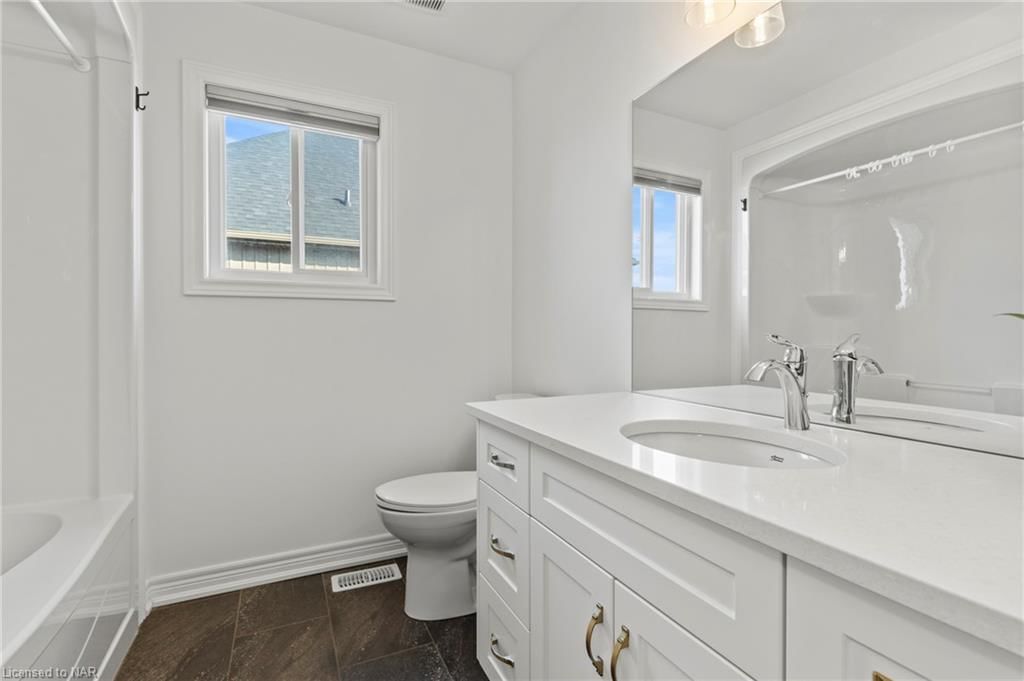
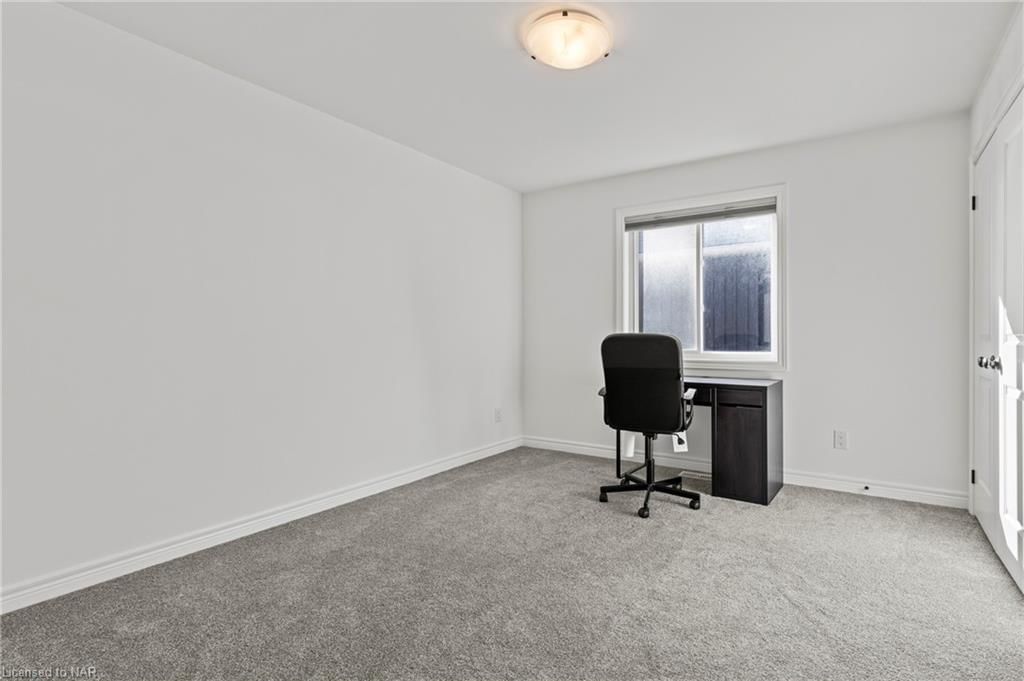
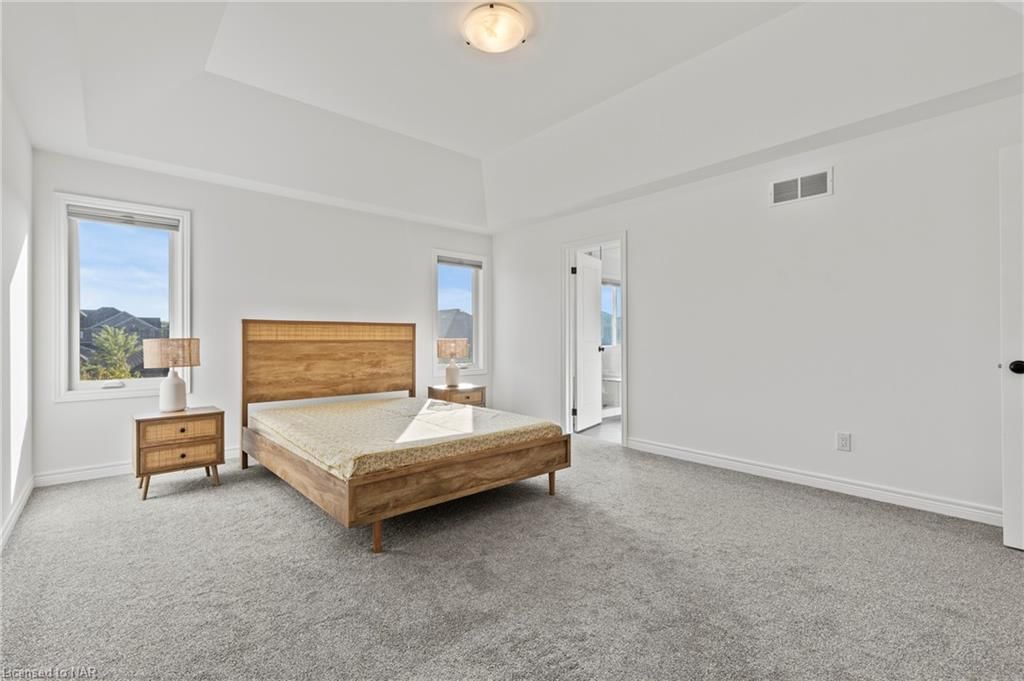
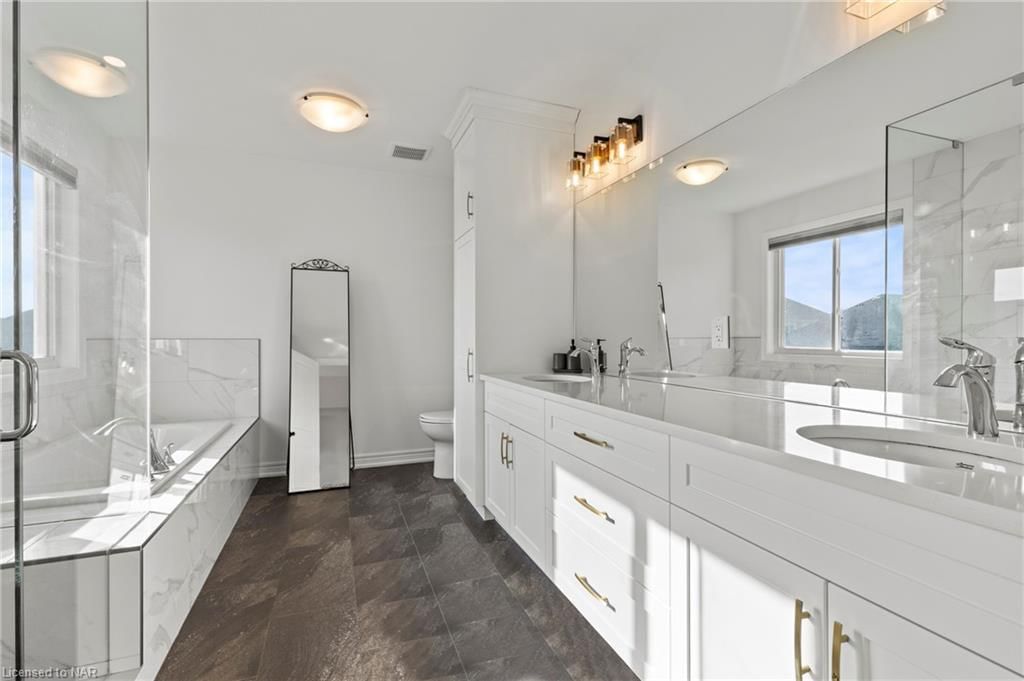
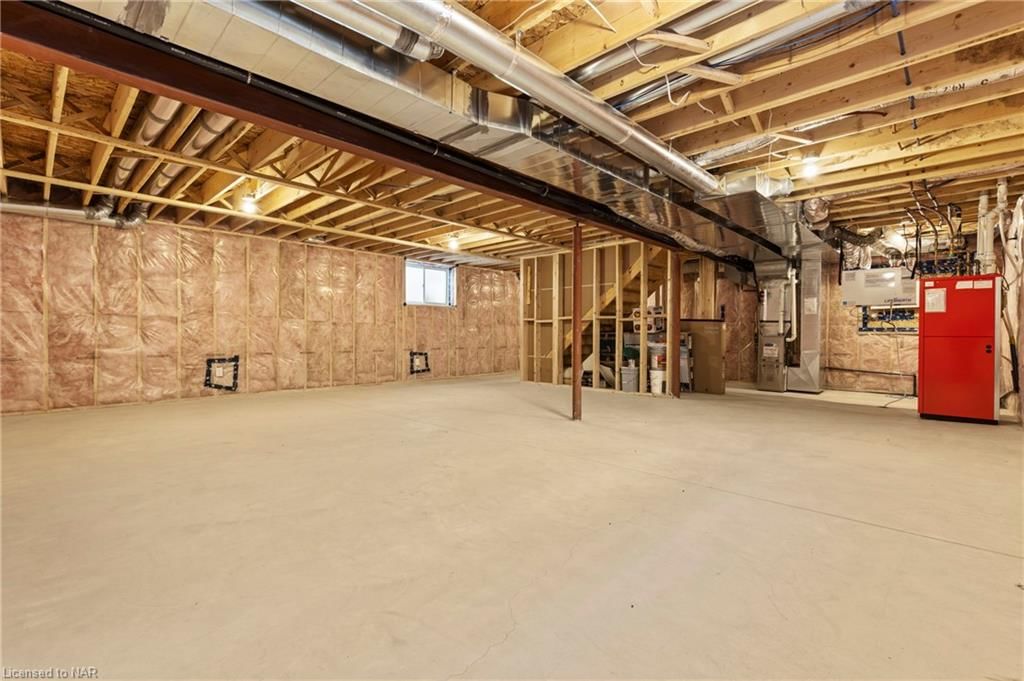
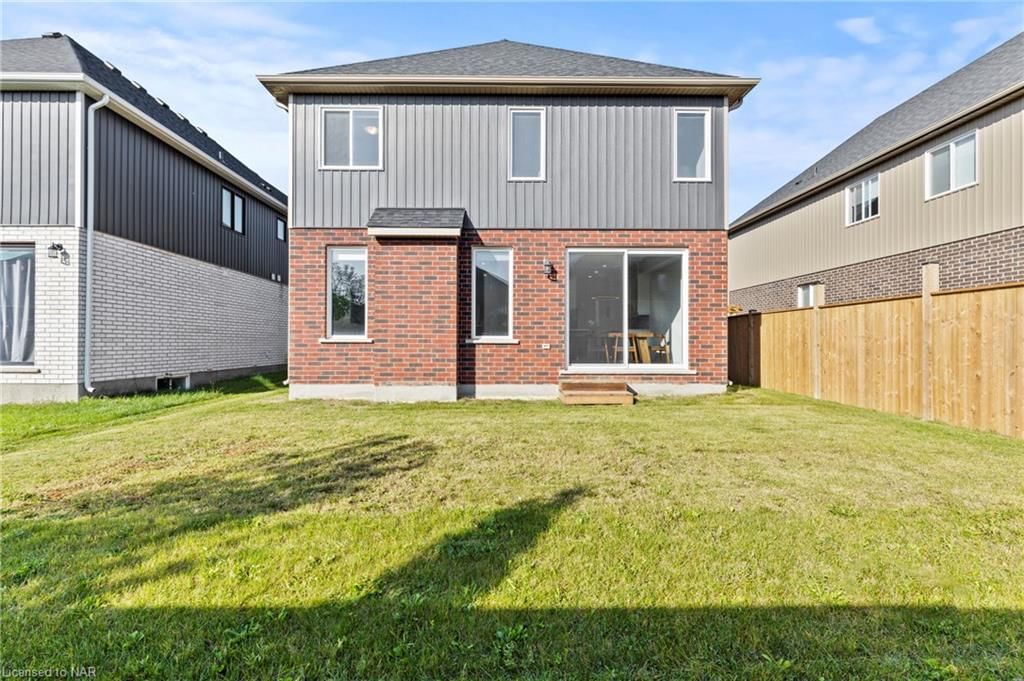
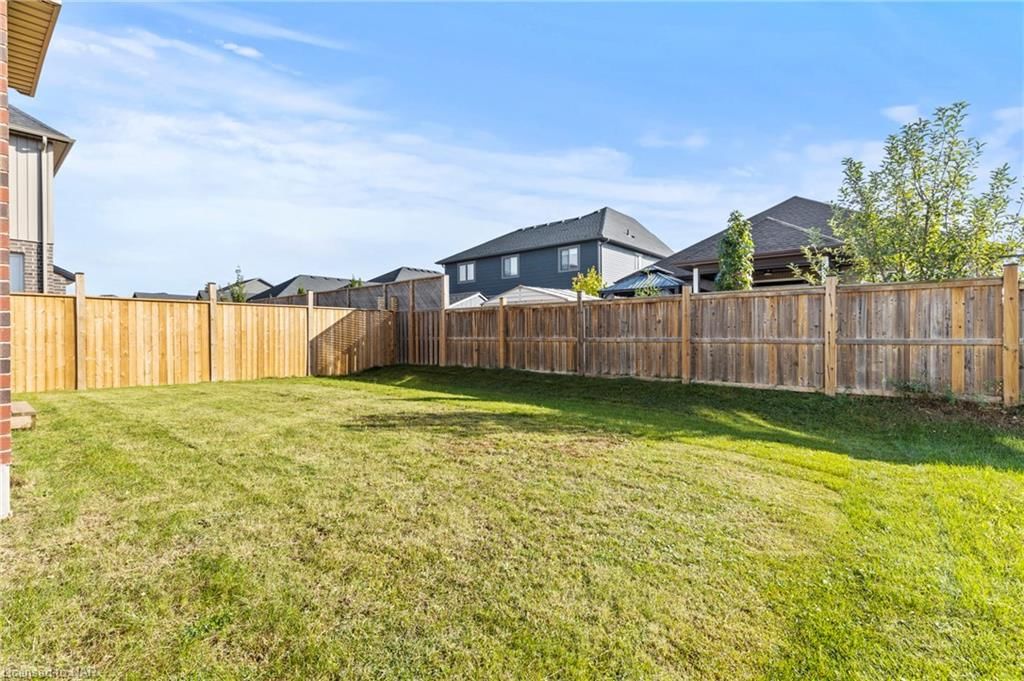
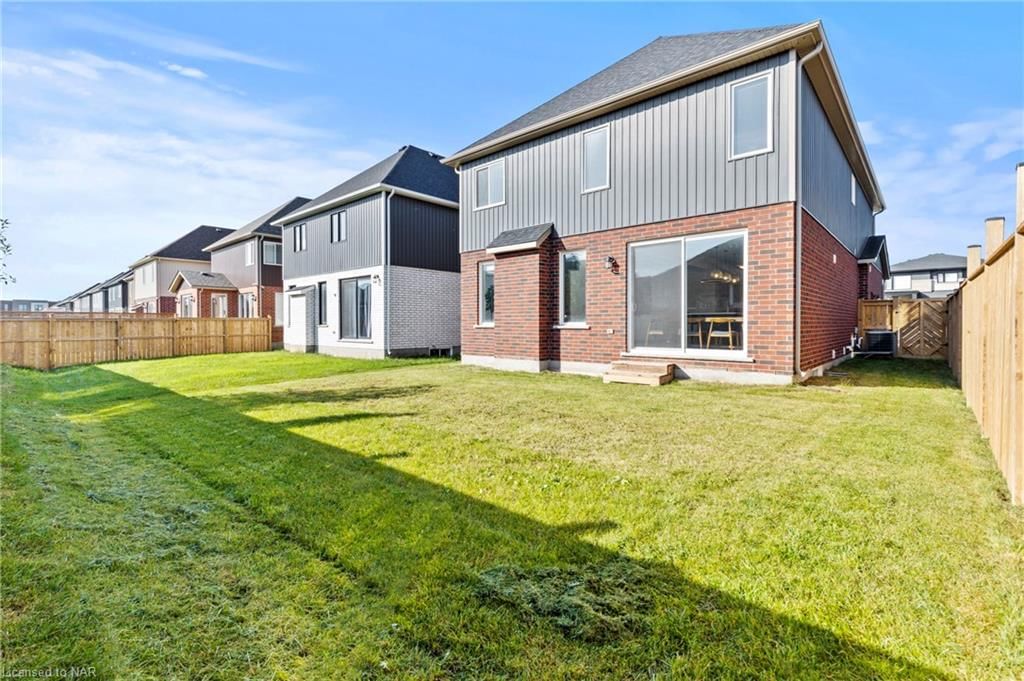
Stunning 4-Bedroom Home in FontHill, Niagara – Built by Kenmore Homes! Welcome to this beautifully crafted 2,288 square foot home nestled in the highly sought-after community of Font Hill, right in the heart of Niagara. Designed and built by renowned Kenmore Homes, this spacious 4-bedroom, 3-bathroom residence offers a perfect blend of style, comfort, and functionality. As you step inside, you're greeted by a grand foyer with soaring ceilings that create a welcoming, open, and airy atmosphere. The main floor boasts an impressive open-concept layout, enhanced by 9-foot ceilings and large windows that fill the space with an abundance of natural light. The modern kitchen is the centerpiece of the home, featuring sleek Quartz countertops, elegant 42-inch custom cabinetry, and soft-close drawers. The large island provides ample workspace and serves as a perfect gathering spot for family and friends. Upstairs, you'll find 4 generously sized bedrooms, including a primary suite with a luxurious ensuite bath. The unfinished basement offers endless possibilities, awaiting your personal touch to create additional living space, a home office, or a recreation room. This home offers an ideal blend of luxury and practicality, perfect for families looking to settle in a vibrant and growing community. Don’t miss the chance to make this home yours!
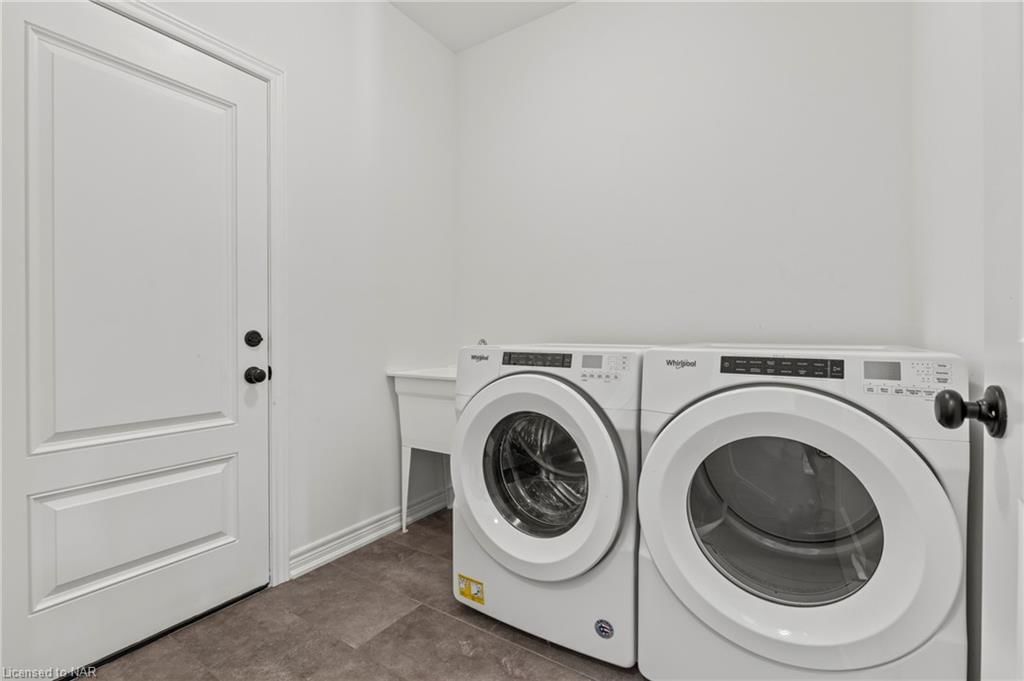
Dishwasher,Dryer,Refrigerator,Stove,Washer
Copyright 2024 Information Technology Systems Ontario, Inc. The information provided herein must only be used by consumers that have a bona fide interest in the purchase, sale, or lease of real estate and may not be used for any commercial purpose or any other purpose.
Bathroom
Bedroom Primary
Laundry
Foyer
Kitchen
Living Room
Dining Room
Pantry
Bedroom
Bedroom
Bedroom
Bathroom
The graph below compares the average list price and average sale price of homes in this neighborhood by month for the last 24 months. When average sale price is greater than average list price, this may suggest a buyer's market. When average sale price is lower than the average list price this may suggest a seller's market.
The graph below illustrates the average days on market for homes in this neighborhood. The yellow area may indicate a buyer's market, the green area may indicate a balanced market and the red area may indicate a seller's market.